At Mozilla, I built tools for data analysis and scientific communication, from shared visualization libraries to a browser-native notebook. My work brought together statistical practice, interface design, and engineering.
I worked part-time alongside my music career, then full-time from 2020. I left in January 2022 to lead application engineering at Rill.
Highlights
- Iodide. Co-created an early WebAssembly-powered data science environment for the browser. Led product strategy, customer discovery, research and development, engineering, and community engagement. The project gave rise to Pyodide, bringing scientific Python to the browser through WebAssembly.
- MetricsGraphics. Co-created and maintained an open-source D3 visualization library with Ali. Grew to more than 7,000 GitHub stars and 50 contributors, with integrations in tools from Stitch Fix, Expedia, and Arroyo.
- Developer and data tools. Designed and built Mozilla’s source-of-truth metrics reporting interface and browser performance tools. Built NLP tooling, contributed to analytics infrastructure, and mentored data scientists and engineers.
- Mozilla Labs. Built opt-in research tooling, analyzed browser datasets, and prototyped browser experiences and visualizations.
Iodide: exploration and explanation together
Iodide let you share interactive reports with code that readers could run and edit in their browser. It was an early WebAssembly-powered data science tool and gave rise to Pyodide in 2018, bringing scientific Python to the web.
MetricsGraphics: a shared language for analytical graphics
Ali and I started MetricsGraphics after repeatedly copying chart code between projects. A shared library let us make the behavior and visual language consistent, and make useful graphics accessible to people who didn’t want to learn all of D3.
The work went beyond drawing marks. It included layouts, annotations, missing observations, linked interactions, and statistical context. My contributions ranged from scatterplots and multiline charts to regression and LOWESS smoothers.
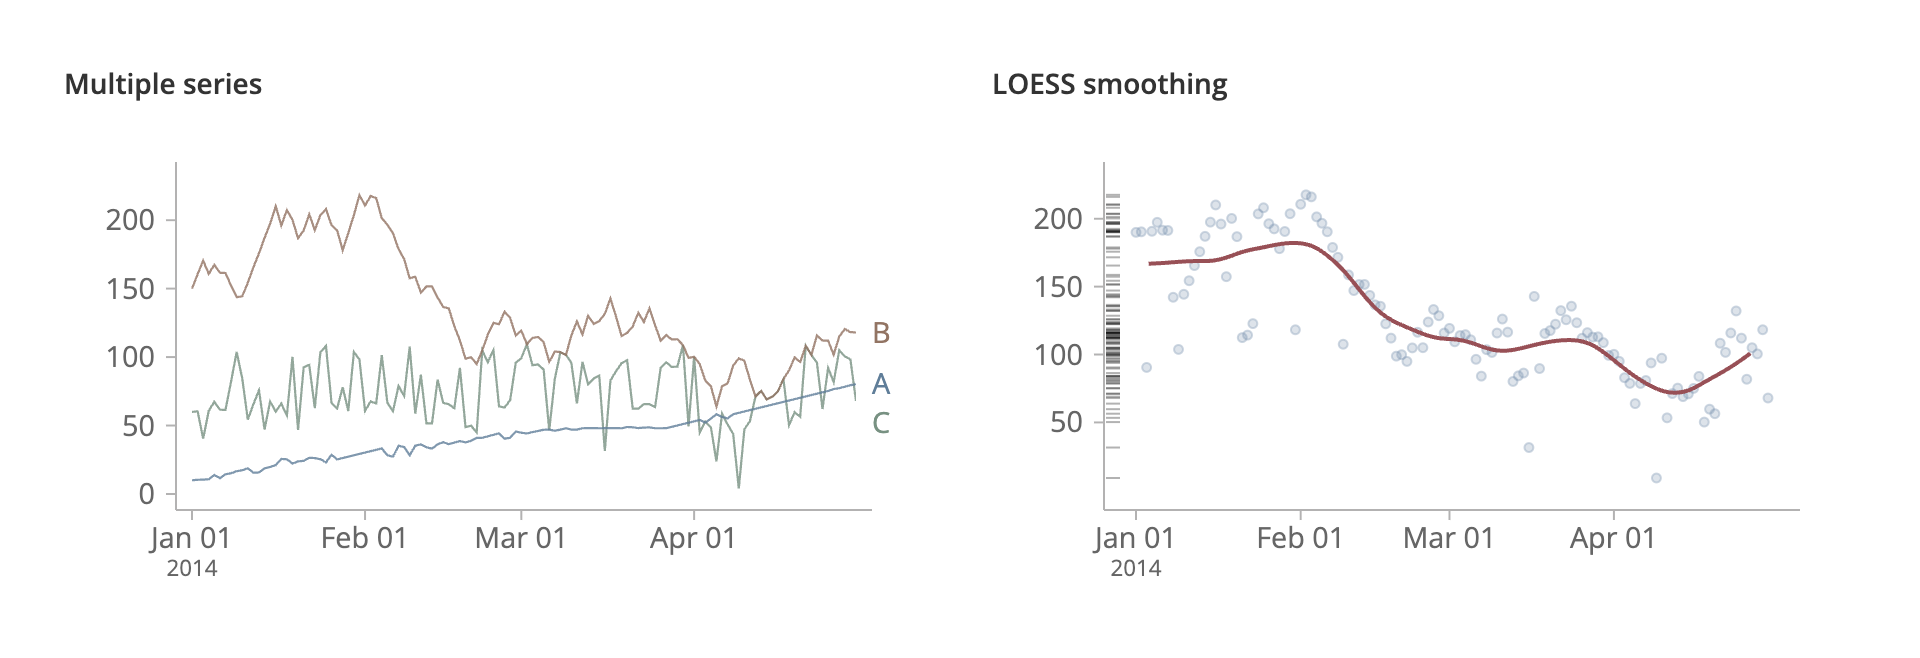
The project grew to more than 7,000 GitHub stars and 50 contributors, with community-built integrations for R, Python, React, Angular, and Rails. It was used in Stitch Fix’s Pyxley, Expedia’s Cyclotron, and Arroyo’s streaming data console.